Here is the uncomfortable truth that organizes everything else about monitoring black bears: you usually cannot tell one from another in a photo. The whole modern camera-trap density toolkit was built on cats. A review of 95 spatially explicit capture-recapture studies found that more than 90 percent of the published density estimates were of carnivores, and that leopards, tigers, and jaguars alone accounted for better than a third of them. Those animals wear their identities on their coats. A black bear does not. Set a camera on a good travel route and you will get gorgeous photos of bears doing bear things, and you will have almost no idea whether you are looking at eight individuals or the same one eight times.
That single fact is why bear monitoring leans so heavily on DNA, why "just put up more cameras" is rarely the right answer for a population estimate, and why some of the most interesting recent work is teaching computers to recognize bears by their faces. If you run surveys, manage a game unit, or volunteer on a serious bear project, the practical question isn't whether cameras are useful — they are — but exactly what job you're asking them to do. Counting bears, detecting presence, reading seasonal behavior, and supporting a DNA estimate are four different jobs, and a camera is excellent at three of them and treacherous at the fourth.
Why count bears at all, and what cameras actually add
Density estimates aren't trivia. They let an agency set harvest objectives, understand how abundance tracks habitat and human development, and judge whether a management action moved the needle. The trouble is that black bears are wide-ranging, low-density, non-territorial animals that violate the tidy assumptions of older counting methods, and they're individually anonymous on camera. So the field has largely settled on collecting genetic identity — hair, snagged on barbed wire at a baited or lured station, genotyped in a lab — and feeding those individual detections into a spatial model.
Cameras earn their place inside that workflow in concrete ways. At a hair station they document which sampling occasion a hair clump was deposited in and help confirm what species and how many animals visited — Washington's statewide crews ran cameras in video mode at their corrals partly to sort out multiple bears at a single site. In a broader winter bait-station study across the Idaho Panhandle, cameras flat-out beat DNA hair snaring at detecting which species showed up, and the authors recommended prioritizing cameras over hair snares at bait stations unless you specifically need genetics. And there's a newer, more ambitious role: cameras as the primary detector in density models that don't need every animal identified, which I'll come back to. For now, hold onto the division of labor. Hair tells you who. Cameras tell you what, when, and how many showed up — and increasingly, with help, who as well.
Hair tells you who. Cameras tell you what, when, and how many showed up — and increasingly, with help, who as well.
The workhorse: spatial capture-recapture on hair-snare DNA
If there's a default method for estimating black bear density today, this is it. You blanket a study area with a grid of hair-collection sites, lure bears in, snag hair on barbed wire, genotype it to identify individuals, and fit a spatial capture-recapture (SCR) model that estimates density from where individuals were detected and re-detected across the array.
The grid designs in the literature are worth memorizing because they're the product of hard-won simulation work. Washington's program standardized on 18 study areas of about 324 km² each, every one a 36-cell grid of 9 km² cells, with one barbed-wire hair enclosure per cell. Utah's multi-year effort used 256 km² grids split into 4 km × 4 km cells, 16 cells per site, visited every 14 days over four occasions. Glacier National Park ran one hair snare per 7 × 7 km grid for roughly 14 days, then moved the trap more than a kilometer within the same cell and ran it again. The common thread: cells sized to a bear's movements, multiple occasions, and enough spatial reach that the same bear gets detected at more than one site.
That last point — spatial recaptures — is the make-or-break of the whole method, and it's where a lot of surveys quietly fail. Utah's case study is the cautionary tale. Across five populations the SCR density estimates ranged from about 3.85 to 74.33 bears per 100 km², but the very highest estimate came from a population with an unusually low number of spatial recaptures relative to total recaptures, which appears to have inflated it. The accompanying simulation made the rule explicit: when fewer than 30 percent of recaptured individuals were re-detected at a different site, density estimates became unreliable and in some cases ran to more than three times the true value. Precision alone won't save you here — a tight, confident, wrong number is still wrong. The authors found that in most cases a single year of data couldn't hit a coefficient of variation below 0.20, and that adding a second year cut CV by about 0.07 on average. Plan for multiple years, or plan to be imprecise.
Array geometry matters just as much as duration, and it interacts with budget. A Missouri study tested the same total trapping effort spread two ways: an extensive design with snares more than 3 km apart over ~13,500 km², versus an intensive design with cells about 2.6 km² and mean nearest-neighbor spacing near 1 km, clustered into multiple arrays. The intensive design produced more detections of more individuals, far better precision, and a density estimate of 1.7 bears/100 km² — about 5.5 times higher than the 0.3 bears/100 km² the thin extensive layout returned, with a statewide abundance of 279 bears (95% CI 193–406). The lesson for anyone allocating a fixed number of traps: clustered, intensive coverage beats a thin net stretched across the whole map. That same study found that adding a second, lower strand of barbed wire to each snare recovered 35 detections and 14 unique bears that the single upper strand missed — including the single largest movement recorded between snares. Two strands, set at different heights, catch the bears the single strand walks under.
Done well, the method is remarkably consistent. Washington's densities ran from roughly 5.6 to nearly 35 bears/100 km² across game-management units, with the highest in the far western and eastern reaches of the state — GMU 615 at 31.2 (CI 17.4–44.0), GMU 117 at 31.1 (CI 25.0–38.6) — and the lowest on the northern Olympic Peninsula and in the southwest. The single most useful management finding wasn't a number but a correction: in western Washington, empirically derived total density including cubs came in nearly 50 percent lower than managers had expected from the old presumed-density approach. That's the value proposition of rigorous monitoring in one sentence — it doesn't just refine your guess, it sometimes overturns it.
Hair snares, bait stations, and the trade-offs nobody tells beginners
Not every project needs the full SCR build-out, and the alternatives carry trade-offs you should choose deliberately rather than stumble into.
A baited hair station and a true bait station aren't the same animal. The hair enclosures in the SCR studies above use an olfactory lure with no food reward — Washington pours about 3 liters of a 2:1 aged-cattle-blood-and-fish-oil mix onto a debris pile inside the wire, explicitly so bears get a scent but no meal. That distinction is methodologically load-bearing. A foundational USGS hair-snare study in northern New York (mean density 0.20 bears/km² from 47 identified individuals) found a positive behavioral response to baited sites and concluded that when you use bait to attract bears, you must include a trap-dependence covariate in the model, because bears learn the sites and come back. Ignore that and your detection probabilities lie to you.
How much do food subsidies bend behavior? A Michigan study put GPS collars on black bears around sites baited for deer and measured the effect directly: bears made three times as many visits and stayed eleven times longer at active bait sites than at controls, and their visits turned more nocturnal — yet their home-range size and movement rates didn't change at all. Bait concentrates visitation locally and shifts it toward night without enlarging the area a bear uses. For anyone interpreting detection rates at a baited camera, that's the whole ballgame: more and longer visits don't mean more bears on the landscape, just more bear-time in front of your lens.
On the question of cameras versus hair snares at a station, the Idaho winter work is clear-eyed. Across 497 bait stations on a 5 × 5 km grid over four winters, cameras detected more species more reliably; genetic species-ID success improved with longer deployment and higher elevation, but individual-ID success improved only when hairs were collected earlier in the season, before late-season rain degraded the DNA. Their guidance: lead with cameras unless you have a specific genetic goal, add a hair snare when you genuinely need individual identity, and deploy winter stations at least 45–60 days to catch low-density, slow-arriving species. If your objective is presence or distribution rather than a population estimate, they note you're better off spreading more stations across the landscape than revisiting the same few.
There's also a real question of which collection device snags the most hair, and the best comparison comes from brown bears in the Polish Carpathians — a different species, so treat the trap-success percentages as method guidance rather than black-bear results. That study tested five trap types and found natural rub trees (50.8% of inspections successful) and "smola" beechwood-tar tree-traps (30.2%) far outperformed corrals, path-traps, and turpentine traps; over three years the tar traps caught up to natural rubs once baited well in advance. The practical translation that does carry across species: barbed wire is favored because it catches larger samples with more follicles and reduces mixed-individual samples, and pre-baiting a site for several weeks before you start collecting materially raises success.
Bait concentrates visitation locally and shifts it toward night without enlarging the area a bear uses.
Counting without genotyping: REM, mark-resight, and why caution is the watchword
Genotyping is expensive and slow. The dream is to estimate density from cameras alone. It's possible — with sharp caveats.
The random encounter model (REM) estimates density from how often unmarked animals trip cameras, the size of the detection zone, and the animals' average movement speed. Tested head-to-head against hair-snare SCR on black bears in Québec's Forillon National Park, REM was in the right neighborhood: the SCR reference density was 2.87 bears/10 km² (95% CI 2.41–3.45), while REM returned 4.06 to 5.38 bears/10 km² depending on which speed value was plugged in. SCR was more precise (REM's coefficient of variation was 39%), but the cameras were genuinely cheaper and lighter to run — about 16,813 CAD and 448 person-hours for the camera deployment versus roughly 21,450 CAD and 672 person-hours for the hair-snag SCR. The catch is that speed parameter. REM is highly sensitive to it for slow-moving species, and underestimating speed — easy to do if your GPS fixes are far apart in time — inflates density. If you can't measure speed in your own population, derive it from more than one outside population and treat the result as a coarse index, not a precise count.
Spatial mark-resight (SMR) threads the needle when only a subset of the population is individually identifiable — say, a handful of GPS-collared or distinctly scarred bears among many anonymous ones. The clearest demonstration of its design sensitivities comes from red foxes in Australia (again, method not species): detection rates were far higher on tracks and trails than off them, yet camera placement had surprisingly little effect on the point density estimate; what drove precision was how often the marked individuals were re-sighted. The takeaway for bear work is to know your animal's movement behavior before you place cameras, and to make sure your marked sample gets seen often.
The most sobering real-world comparison comes from northeastern Oregon, where researchers estimated densities of black bears, bobcats, cougars, and coyotes with a whole ladder of models from fully unmarked up to a hybrid that fused genetics, GPS, and cameras. For bears, the camera-based generalized spatial mark-resight estimate landed within 10 percent of the genetic SCR benchmark (9.9 bears/100 km², 95% CI 6.1–14.9) once sex was accounted for. But the fully unmarked models were wild: spatial-count estimates without telemetry ran on average more than 770 percent higher than the SCR benchmark across species. The hybrid model that pulled in every data stream was the most precise of all. The authors' recommendation is one every survey designer should tape to the wall: where data are sparse and the strict assumptions won't hold, be very cautious drawing inference from models that lack individual identity, and lean toward methods that mark at least a subset of the population.
Putting cameras and hair snares where bears actually are
The placement specifics scattered across the agency protocols are the kind of detail that separates a productive set from 2,000 photos of nothing.
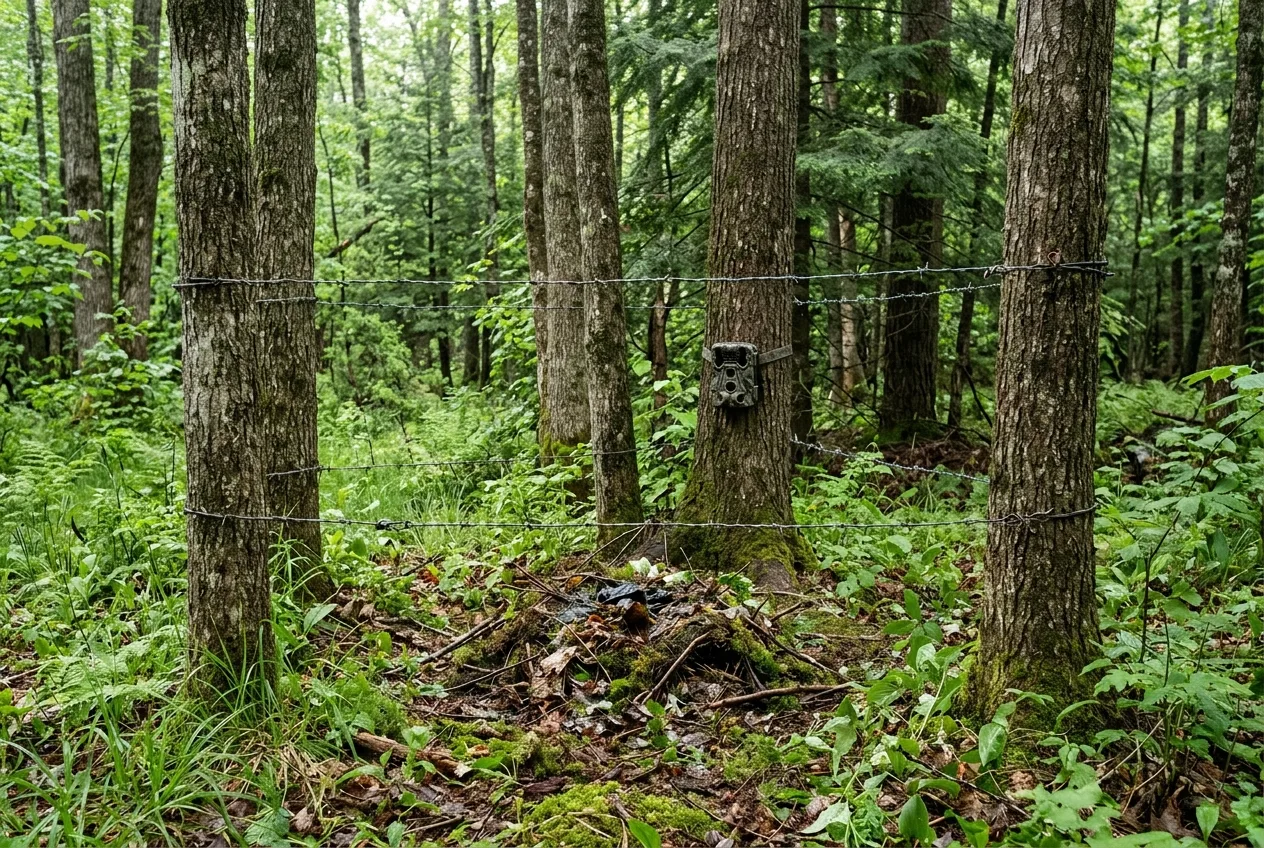
Wire heights. Washington's enclosures use two strands at 35 cm and 65 cm above the ground, stretched around three to six trees. The Polish brown-bear corrals used a single strand at 50–60 cm; their tree-traps stacked three strands about 50 cm apart with the lowest at 50–60 cm. Two heights beat one, as Missouri's lower-strand result showed.
Camera aspect and orientation. Point the camera toward the nearer pole — north in the northern hemisphere, south in the southern — to keep the daytime sun from triggering it and from backlighting your subjects, and never aim it due east or west; that's standard in the North Cascades grizzly protocol, which sets the camera about 15 feet from a baited debris pile. For deep-snow or year-round sets, rotating the camera 90° into "portrait" orientation captures an animal from the base of the tree up to a high lure, regardless of snowpack.
Settings. The grizzly protocol runs cameras at 3 shots per trigger, 1-second delay — continuous bursts are what make a definitive identification possible when an animal turns its head. The overwinter carnivore protocol used five images per trigger on 32 GB cards to bank as much as possible from unattended stations. With bears, more frames per visit is almost always the right call, because the diagnostic angle — face, profile, any chest marking — may only appear in one of them.
Lure and bait handling. The blood-and-fish-oil olfactory lures recur everywhere, and the durability question answers itself: in a year-long unattended deployment, despite frequent visits by American black bears, the bears did not damage or dislodge a single camera or scent dispenser. Bears are curious, not necessarily destructive, toward well-built stations. For your own safety, keep lure at least 50 m from any camp and never bring it into a tent.
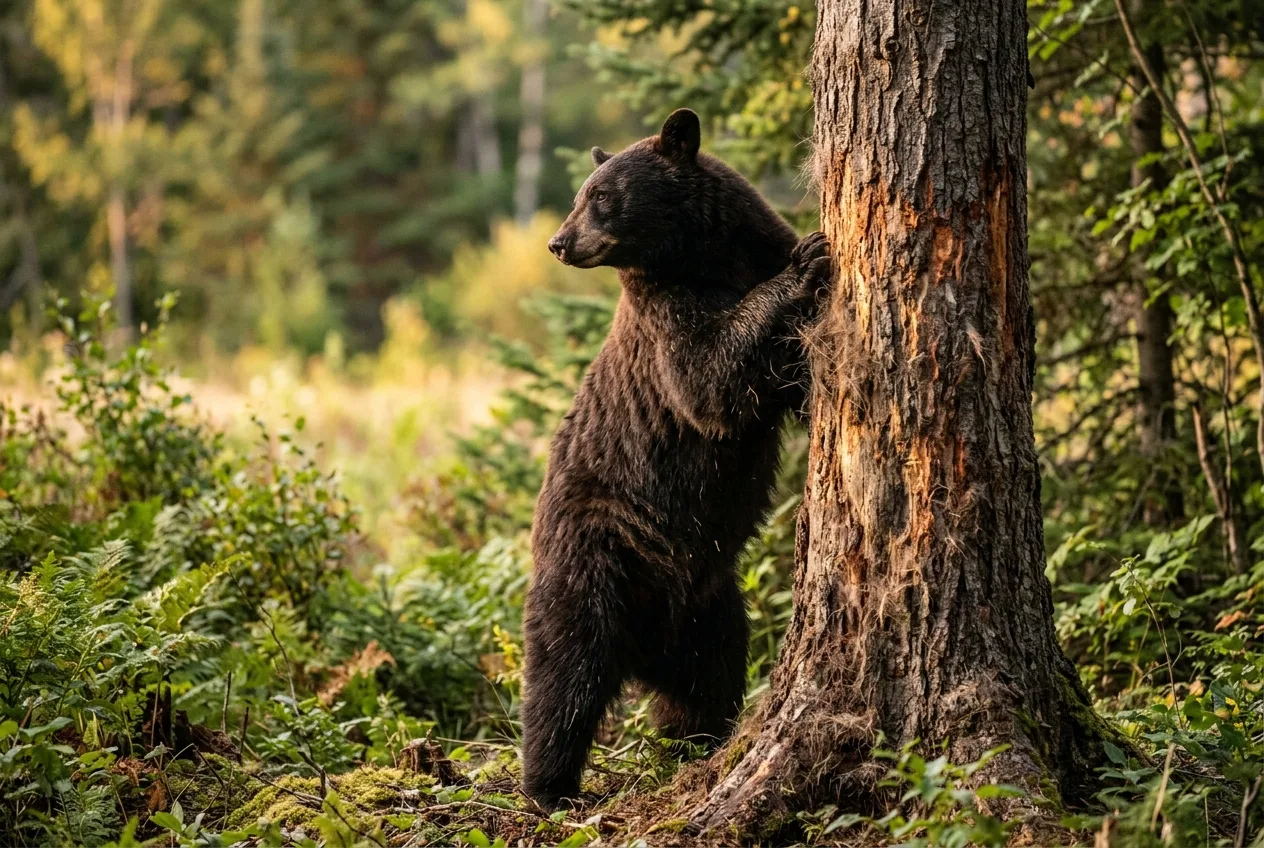
Rub trees — useful but biased. Bears mark the same rub trees year after year, often along travel corridors at the edge of an opening, which makes them reliable, reusable camera and hair-snag sites. They also draw other wildlife; one Alaska biologist's cameras caught deer and wolves investigating the same trees bears had just marked. But there's a catch that has burned more than one survey: rub-tree hair is heavily male-biased. In one Alaska study, only males were identified at rub trees; when the same crew set purpose-built hair snares nearby, they found three times as many individual bears, and more females. Use rub trees, but don't let them be your only sampling structure or your sex ratio will lie.
The individual-ID problem and the rise of bear facial recognition
Back to the anonymity problem, because it's where the field is moving fastest. American black bears, brown bears, polar bears, and sloth bears generally lack the consistent, unique markings that let observers tell individuals apart — unlike Andean bears, Asiatic black bears, sun bears, and to some extent giant pandas, which carry distinctive face or chest patterns. Black bears do often show a pale chest blaze, sometimes a vivid "V", but it's not reliable or stable enough to anchor a census. That's the root reason classic camera-SECR underserves bears.
Two threads are loosening the knot. The first is methodological: the mark-resight and hybrid models above let cameras contribute to density even when most animals can't be named. The second is artificial intelligence. The BearID project trained a deep-learning facial-recognition pipeline — face detection, reorientation, embedding, classification — on 4,675 images of 132 individual brown bears, achieving a facial-detection average precision of about 0.98 and individual-classification accuracy of 83.9 percent. Brown bears, note, not black — but the entire point is that the method targets species without unique markings, which is exactly the black bear's situation, and the authors explicitly pitch pairing it with camera traps for individual spatiotemporal monitoring and mark-recapture. A follow-up built a face detector spanning all eight bear species, the American black bear included, with average precision from 0.91 to 1.00 across species and 86 percent correct individual identification in a test on Andean bears. It's early, and accuracy in the low-to-mid 80s isn't good enough to run a harvest model on yet, but the trajectory is real: a camera network plus a trained classifier could one day deliver the individual encounter histories that today require a genetics lab.
Two threads are loosening the knot.
Reading the seasons: what the timing actually tells you
Cameras and collars don't just count bears; they read the calendar bears live by. And that calendar is tightly choreographed enough that you can use it — to time a survey, to interpret a detection spike, to know when a "missing" bear is simply denned.
Spring emergence runs on sex and reproductive status. On Prince of Wales Island in Southeast Alaska, GPS-collared bears showed median den-emergence dates of 5 April for males, 13 April for females without cubs, and 12 April for females with cubs. In Nevada's arid eastern Sierra, mean den exit was 12 March for males and 28 March for females, with females entering earlier and leaving later than males across the board. The National Park Service frames the order plainly: bears without cubs emerge first in early spring, and mothers with cubs come out last, typically late March or early April. Many bears don't simply spring back to life, either — the Alaska study documented "walking hibernation," a post-emergence stretch of several days with less than 300 m of daily movement before normal activity resumed. A collared bear that emerges and then barely moves hasn't malfunctioned; it's transitioning.
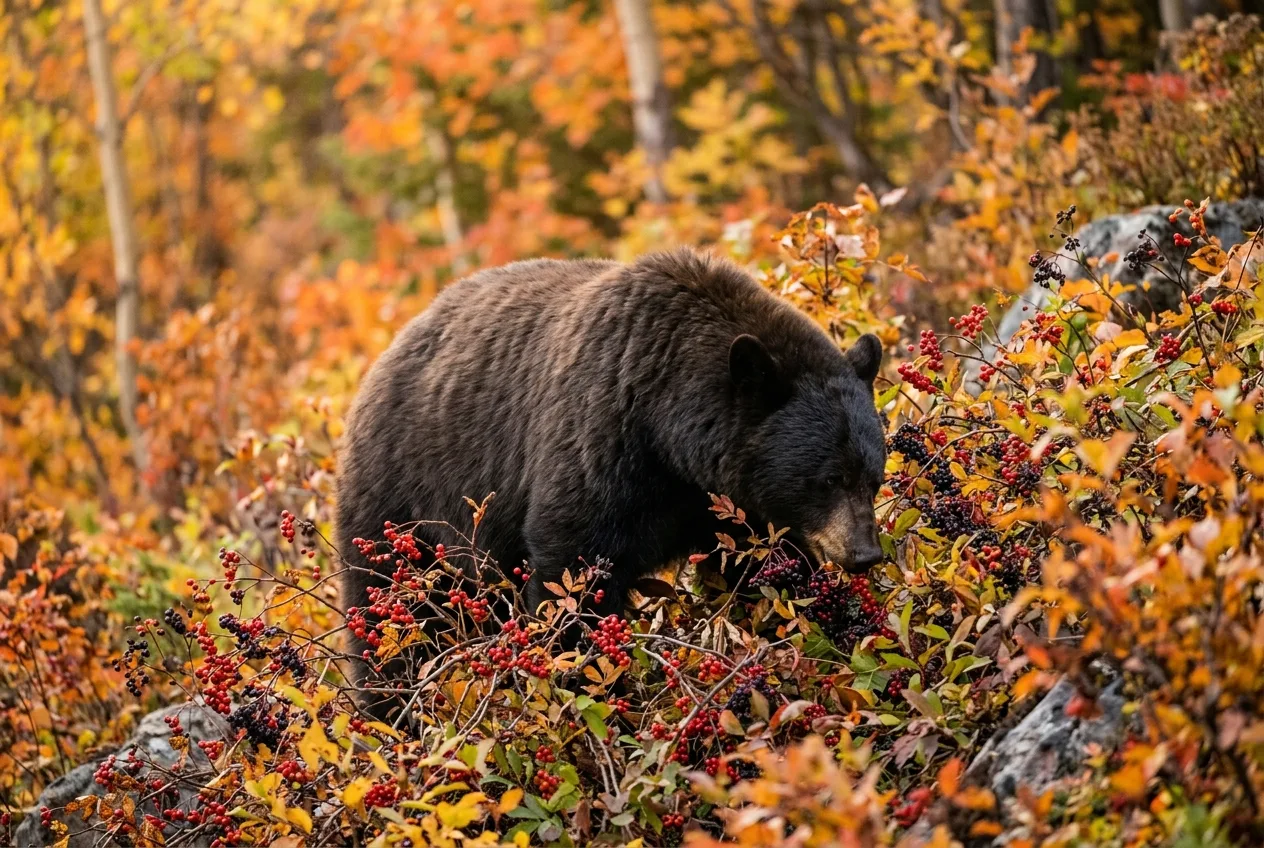
Summer-into-fall hyperphagia is the loudest signal on the calendar, and it's the one most likely to show up in your data as a sudden surge of detections and conflict reports. In Florida, daily intake jumps from roughly 5,000 calories in summer to as much as 20,000 in the fall, with bears foraging up to 18 hours a day and gaining as much as one-and-a-half times their summer weight. North Carolina's agency puts the fall pace at up to 3 pounds gained per day and a weight gain anywhere from 20 percent to nearly 100 percent of summer mass, with bears ranging well beyond their normal home ranges in the search. Missouri biologists clock normal daily intake at 10,000–12,000 kilocalories rising to well over 20,000 during hyperphagia, fueling a weight gain north of 30 percent. The critical management point, stated cleanly by North Carolina: it's natural food scarcity, not temperature, that switches hyperphagia on — so even bears that den only briefly or not at all still feed around the clock in fall. That fall movement is visible in agency records: in a Pennsylvania season following an acorn shortage, the state logged 340 bear-vehicle collisions, more than any prior year, attributed to bears traveling farther for food. When your detection rates and your roadkill reports both spike in October, the bears aren't more abundant — they're hungrier and moving more.
Denning timing closes the loop, and it's both predictable and plastic. Females generally den first — Pennsylvania's pregnant females enter typically in mid-to-late November, with males following weeks later; Nevada's mean entry was 6 December for females and 16 December for males; Alaska's median entry ran from 1 November (females with cubs) to 15 November. But the duration swings enormously with latitude and food. Minnesota bears can hold a den for six or seven months; the Park Service cites up to six months, and about seven in colder Alaska; Missouri notes bears in mild conditions may hibernate only briefly; and a Nevada review found the hibernation period can range anywhere from 0 to 212 days depending on food and winter severity. In warm climates some bears barely den, and those with reliable year-round human food may not den at all. So a black bear's "winter" is a moving target — which is exactly why agency monitoring runs hair-snare sampling in the snow-free window. Washington deliberately ran its capture-recapture from late May through July, before the August hunting season and outside the denning months.
That seasonal turnover is also a quiet source of bias in the counts themselves. Bears move in and out of a survey grid as foods shift, and Washington documented the consequence bluntly: more than half the bears detected in the fourth sampling occasion had never been detected in the first three. Demographic closure — the assumption that the population isn't changing during sampling — is an approximation, and a leaky one, when your subject animal is chasing a moving buffet.
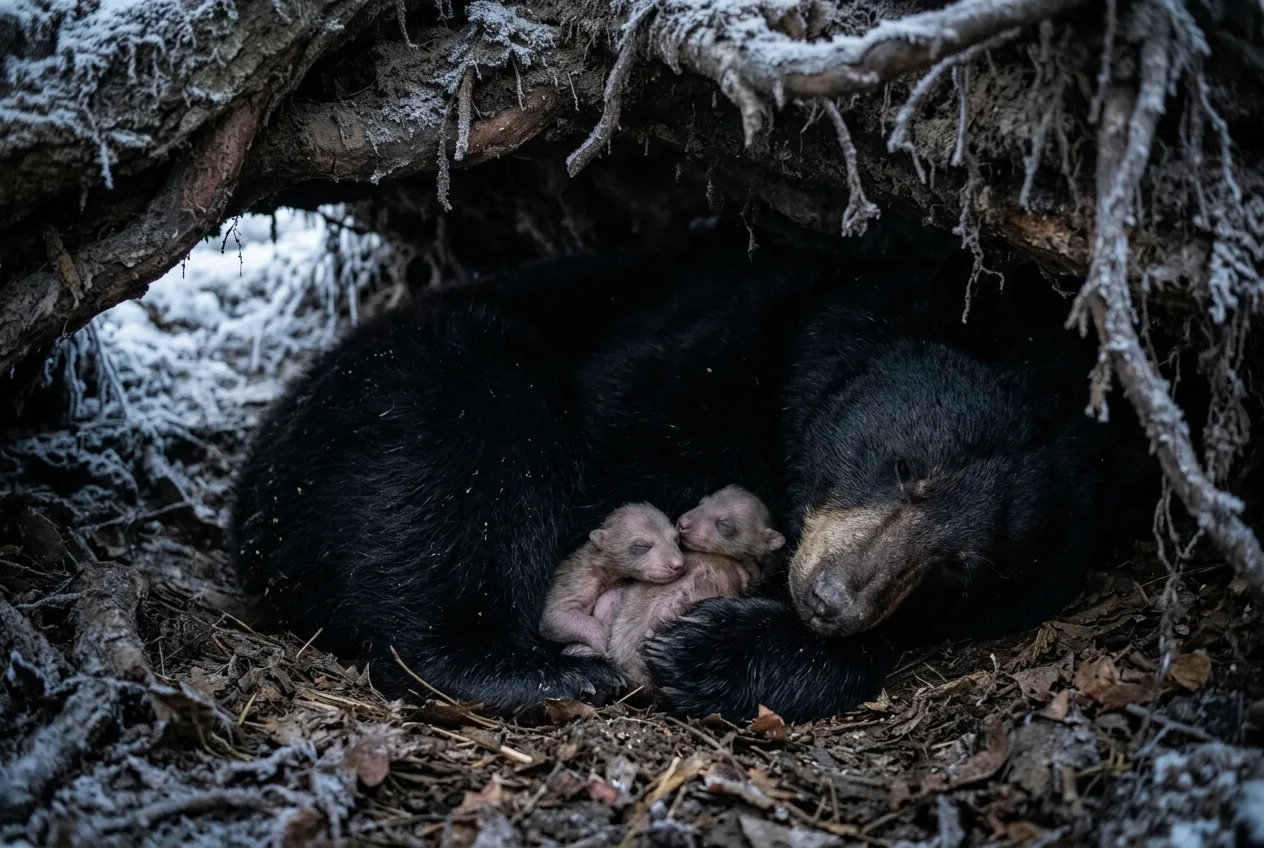
Birth in the den, and the cameras that finally saw it
The most private chapter of the bear year was, until recently, invisible. Black bears in northeastern Minnesota typically produce their first litters at three to eight years of age in January, the coldest month, and the cubs are astonishingly altricial — a Missouri example puts a 150-pound mother at 200 times the weight of her 12-ounce newborn. In-den remote cameras changed what we can observe: a multi-year study using webcams and more than 14,000 hours of archived video captured wild black bears giving birth, licking membranes off newborns, warming them in sub-freezing temperatures, and the cubs' eyes opening and play emerging weeks later — behaviors that previously could only be inferred after the family left the den. Den-camera and collar work is also how agencies estimate the reproductive parameters that feed population models. Missouri biologists collar female bears each year and track them to winter dens to measure litter size, sex ratio, and cub survival, finding about 60 percent of females reproduce annually with an average of two cubs, and first-year survival around 70 percent for male cubs and 90 percent for females. Florida times its den visits to early spring, when a collared female slips out briefly and gives biologists a window to count and sex the cubs.
It's worth noting that reported litter sizes are genuinely regional, so cite the right one: Minnesota averages about 2.6 cubs, Pennsylvania's litters run one to five with three most common, Missouri's normal litter is two, and the Park Service gives a one-to-three range. There is no single "black bear litter size," only a local one.
There is no single "black bear litter size," only a local one.
How agencies actually estimate populations — three working models
Pull back, and you can see the whole monitoring landscape in a few real programs.
Pennsylvania built its long-running estimate on classic ear-tag mark-recapture: biologists tagged 422 bears between hunting seasons, recovered 58 of the 404 still afield at check stations during a three-day hunt, and ran the recovery rate (14.4 percent) through a Lincoln-Petersen-type estimator to get a preseason population of 11,957 (95% CI 9,659–15,394). That report is dated — the program targets 600 captures a year to keep confidence intervals within about 15 percent of the estimate, and confidence intervals balloon when tagging drops. The state's current statewide estimate is roughly 19,000 bears, up from fewer than 5,000 in the 1970s, across more than three-quarters of Pennsylvania. Florida instead runs hair-corral DNA arrays to estimate abundance and density in each of seven Bear Management Units about once a decade, supplementing with multi-year tracking of collared females for demographics. Missouri leans on a population model fed by den research — female survival, cub production, cub survival, litter sex ratios — to put its growing population at roughly 800 to 1,000 bears in the southern Ozarks.
For scale, the methods now reach genuinely large landscapes. California's recent integrated population modeling — combining genetics, cameras, and harvest data across the state's Bear Conservation Regions — has put that state's black bears at roughly 60,000. (That figure comes from the research pack's summary of the California study rather than from the paper itself, which wasn't available to read in full, so treat it as a reported headline rather than a verified value.) The direction of travel is unmistakable: integrate every data stream you can — hair, cameras, collars, harvest — into one coherent model, because no single detector counts a black bear well on its own.
Frequently asked questions
Can you tell individual black bears apart from trail camera photos?
Usually not reliably. American black bears generally lack the consistent, unique markings that let you identify individuals by sight, which is why population estimates lean on hair-snare DNA rather than photos alone. A pale chest blaze exists on many bears but isn't dependable enough for a census. Deep-learning facial recognition is changing this — a multispecies bear face detector covering the American black bear reached 0.91–1.00 average precision, though individual-ID accuracy is still in the low-to-mid 80s.
What's the best way to count black bears in an area?
For a defensible density estimate, the field standard is spatial capture-recapture on hair-snare DNA: a grid of barbed-wire hair sites, individuals identified genetically, modeled by where they're detected and re-detected. The single biggest failure mode is too few spatial recaptures — when under 30 percent of recaptured bears are seen at a second site, estimates become unreliable, and one year of data often can't reach acceptable precision.
How high should the barbed wire be on a black bear hair snare?
Agency designs use two strands, commonly around 35 cm and 65 cm above the ground, stretched around three to six trees with a scent lure in the center; single-strand corrals are often set at 50–60 cm. Two strands at different heights matter — a lower strand can recover unique bears the upper strand misses entirely.
When are black bears most active for camera surveys?
Black bears are typically most active at dawn and dusk, shifting more nocturnal near people or at bait. Activity peaks in fall hyperphagia, when bears forage up to 18–20 hours a day and range widely in search of food. Agencies generally run hair-snare sampling in the snow-free late-spring-to-summer window, before hunting seasons and outside denning.
Do bears damage trail cameras?
Less than you'd expect at well-built stations. In a year-long unattended deployment, despite frequent visits by American black bears, the bears didn't damage or dislodge any cameras or scent dispensers. Mount securely, point the camera toward the nearer pole (north in the northern hemisphere, south in the southern) to keep the midday sun out of frame and avoid sun triggers, and keep lure well away from camp for your own safety.
When do black bears emerge from their dens in spring?
It depends on sex, reproductive status, and latitude. Bears without cubs emerge first; females with cubs come out last, often late March to early April. GPS studies put median male emergence around early-to-mid March (Nevada) or early April (Southeast Alaska), with females later. Many bears go through "walking hibernation" — several days of minimal movement — right after leaving the den.