Here's the honest answer to the question in the title: you can't count every deer on your property, and anyone who tells you they can is selling something. But you can do the next best thing, and it's remarkably good. With a grid of baited trail cameras, two weeks of work, and a calculator, you can produce a defensible estimate of how many deer live on your land, how the bucks and does stack up against each other, and how many fawns made it through the summer.
That's what a trail camera deer survey is: a structured, repeatable way to photograph as much of your herd as possible, then use the one group of animals you can tell apart — antlered bucks — to scale up to the whole population. In some situations a properly run survey will photographically record 80 to 90 percent of the deer herd, which is more than enough to build reliable management information. The method has been around since a 1997 study on a Mississippi farm proved it worked, and every state extension service in deer country now publishes its own version of the same recipe.
This guide walks the whole thing: how many cameras you need, when to run it, how to set up bait sites, how to actually run the survey, and — the part most articles rush — how to turn a folder of photos into population numbers you can trust. I'll also be straight with you about where the method gets shaky, because knowing its limits is what separates a useful estimate from a confident wrong one.
Why bother? What a camera survey actually tells you
Plenty of landowners run cameras for years just to scout bucks. A survey takes that same gear and squeezes real demographic data out of it. Done right, it gives you four things:
- Population and density — roughly how many deer use the property, expressed as acres per deer.
- Adult sex ratio — the number of does per buck, your single best signal of whether you're over-harvesting bucks or under-harvesting does.
- Fawn recruitment — fawns per doe, the productivity gauge that should drive your doe harvest.
- Buck age structure — which bucks are out there, how old they look, and which ones to target or protect.
Why cameras instead of the older tools? Land managers have leaned on spotlight counts, pellet-group counts, drive counts, aerial and thermal surveys, and track counts since the 1930s. Those methods can be expensive, labor-intensive, or only work in open country with good visibility — they fall apart in thick timber. Cameras flip that. They're cheap to run, non-intrusive, work in dense forest, and leave you a permanent photographic record of every animal you caught. The National Deer Association puts it bluntly: a trail-camera survey is "the most powerful deer herd monitoring tool you can use that doesn't require the assistance of a professional wildlife biologist".
One framing worth keeping in your head before you start, from the Oklahoma wildlife agency: this survey "is designed to establish trends and estimate deer numbers. Trail camera surveys do not provide a complete census of your herd". The real payoff isn't a single magic number this year. It's running the same survey, the same way, every year, and watching the trend.
How many cameras, and where
The number that matters most is camera density, and the field has settled on a clear rule of thumb: one camera per 100 acres. For larger tracts, several guides relax that to one per 160 acres, and the original Texas brochure frames it as one camera per 100 to 160 acres. If you're choosing, err toward more cameras, not fewer.
This isn't an arbitrary number, and the reason it matters cuts to the heart of the method's accuracy. In the founding study, researchers tested three densities — 65, 130, and 259 hectares per camera — and found something that should make you want to over-camera rather than under-camera: at low camera densities, bucks got recaptured far more reliably than does, because a buck's home range is typically about twice the size of a doe's. Spread your cameras too thin and you over-sample the wide-ranging bucks and miss does, which skews your whole sex ratio. As the Oklahoma State guide says plainly, "bucks tend to dominate camera sites when only a few cameras are present, making estimates of sex ratios unreliable".
That has a hard consequence for small properties. Below about 1,000 acres, free-range sex ratios get unreliable, and the standard advice is to either saturate the property with more cameras per acre or — better — team up with your neighbors and run a survey across the whole block as a hunt cooperative. Deer don't respect property lines, and neither should your survey design.
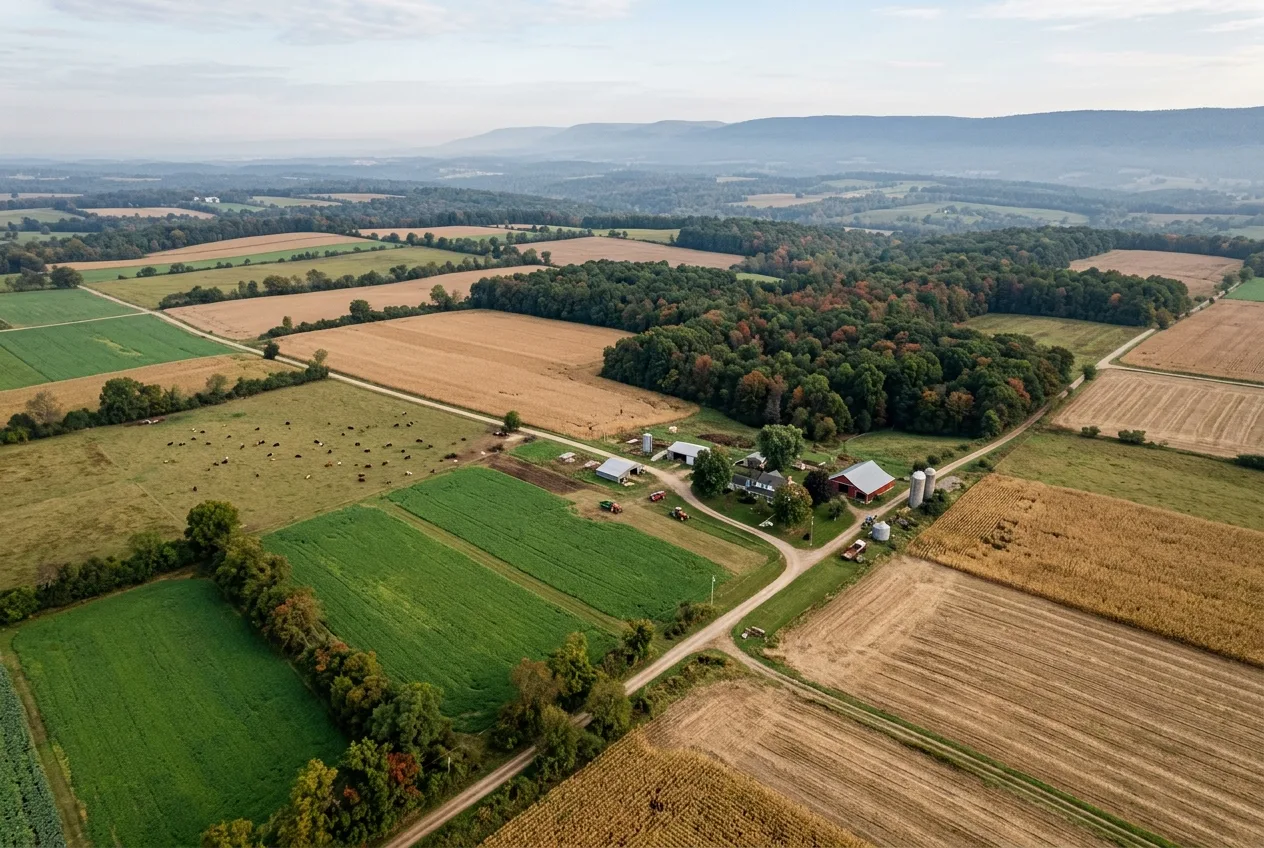
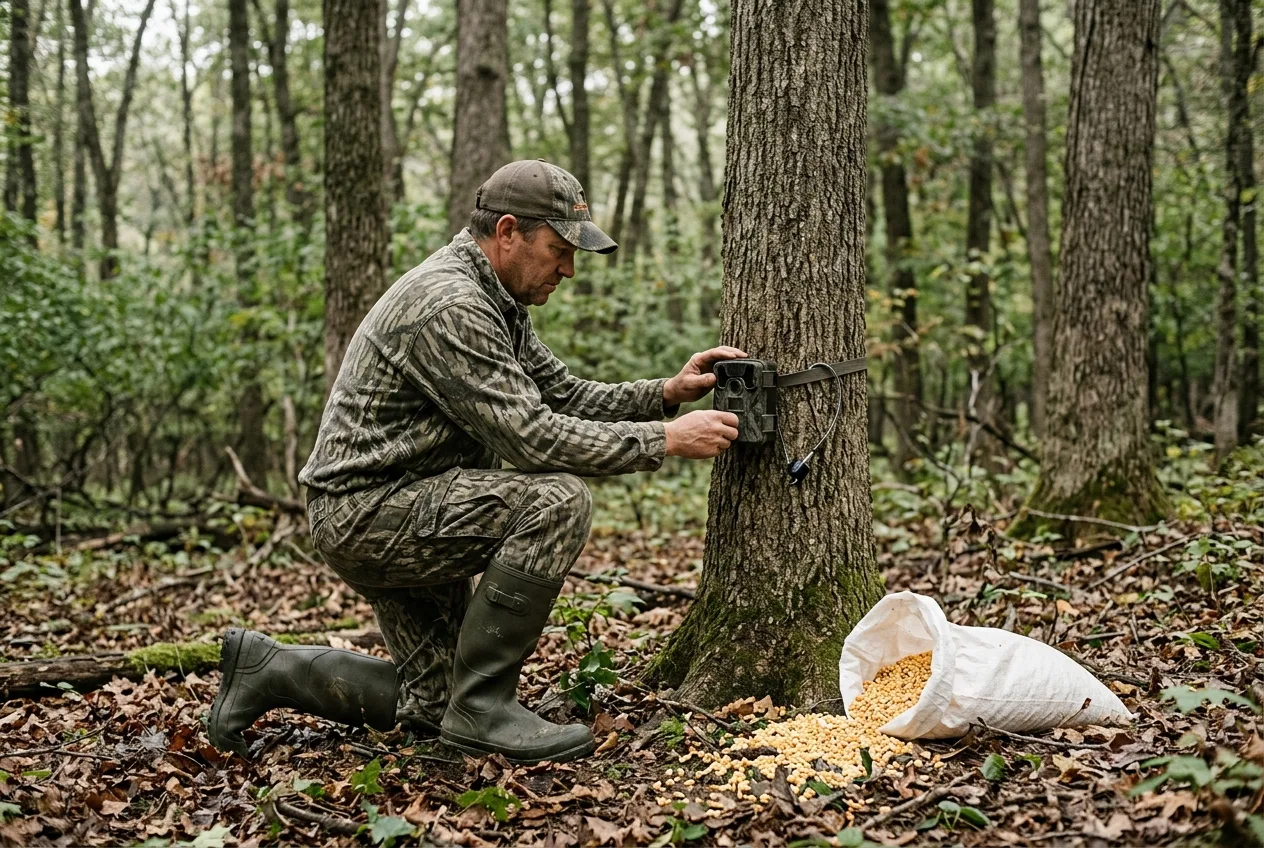
For placement, forget the textbook image of a camera dead-center in each grid cell. Deer aren't evenly distributed; they concentrate where the food, cover, and water are. Grid your aerial photo into roughly 100-acre blocks, but within each block put the camera where deer actually travel — field edges, two-track and skid roads, heavily used trails, the approaches to food plots. Face the camera away from the midday sun — north in the northern hemisphere, south in the southern — so the sun doesn't blow out your images, mount it about waist height (roughly 2.5 to 3 feet), and pick a spot with a closed background like a tree or brush line 10 to 15 yards behind the bait, which gives you the contrast you need to tell bucks from does, especially at night. Clear the grass and limbs out of the detection zone — a single waving blade can trigger hundreds of empty frames.
A genuinely useful point from the German camera-trap research, even though it studied red and roe deer: when they broke down what drove the variation in their density estimates, differences in how many photos each location produced explained 65 percent or more of it — far more than any quirk of deer behavior. Their takeaway translates directly: putting cameras at representative, deer-used spots matters more than almost anything else you'll fuss over.
Putting cameras at representative, deer-used spots matters more than almost anything else you'll fuss over.
When to run it
Timing is dictated by three things: bucks need to have hardened antlers so you can tell them apart, fawns need to be old enough to tag along with their mothers, and natural food — acorns especially — must not be competing with your bait. Get those three lined up and you have your window.
In practice that means two seasons. Pre-season runs from late summer into early fall, after antlers have finished growing but before acorns drop. Post-season runs after the hunt closes but before bucks shed their antlers. The exact calendar shifts by latitude — Texas points to September and October, Oklahoma's agency suggests mid-August to mid-September for pre-season and January (before antler drop) for post-season, and Mississippi's deer lab runs as early as late August and as late as early February. Check your own state and, critically, your own rut: if your rut peaks late (late December into January), wait until October for a pre-season survey so the fawns are mobile and showing up in photos.
The single biggest timing trap is acorns. Once hard mast is dropping in quantity, deer walk past your corn, your photo rate craters, and you'll badly underestimate the herd. Schedule around the acorn crop, not your own convenience.
There's a subtler trap specific to fawns. A September–October survey will underestimate the fawn crop if your peak fawning is late July through mid-August, simply because those fawns are still too young to follow does to bait sites. The biologists who study recruitment for a living confirm it: pre-season surveys underestimate fawns-per-doe because many fawns aren't yet mobile, while a post-season January–February survey gives a truer count — at the cost of fawns being harder to tell from does, and the need to add harvested does and fawns back into your totals. If fawn recruitment is your main question, lean post-season and budget time to study antlerless photos before you start.
Bait, pre-baiting, and the consistency that makes or breaks it
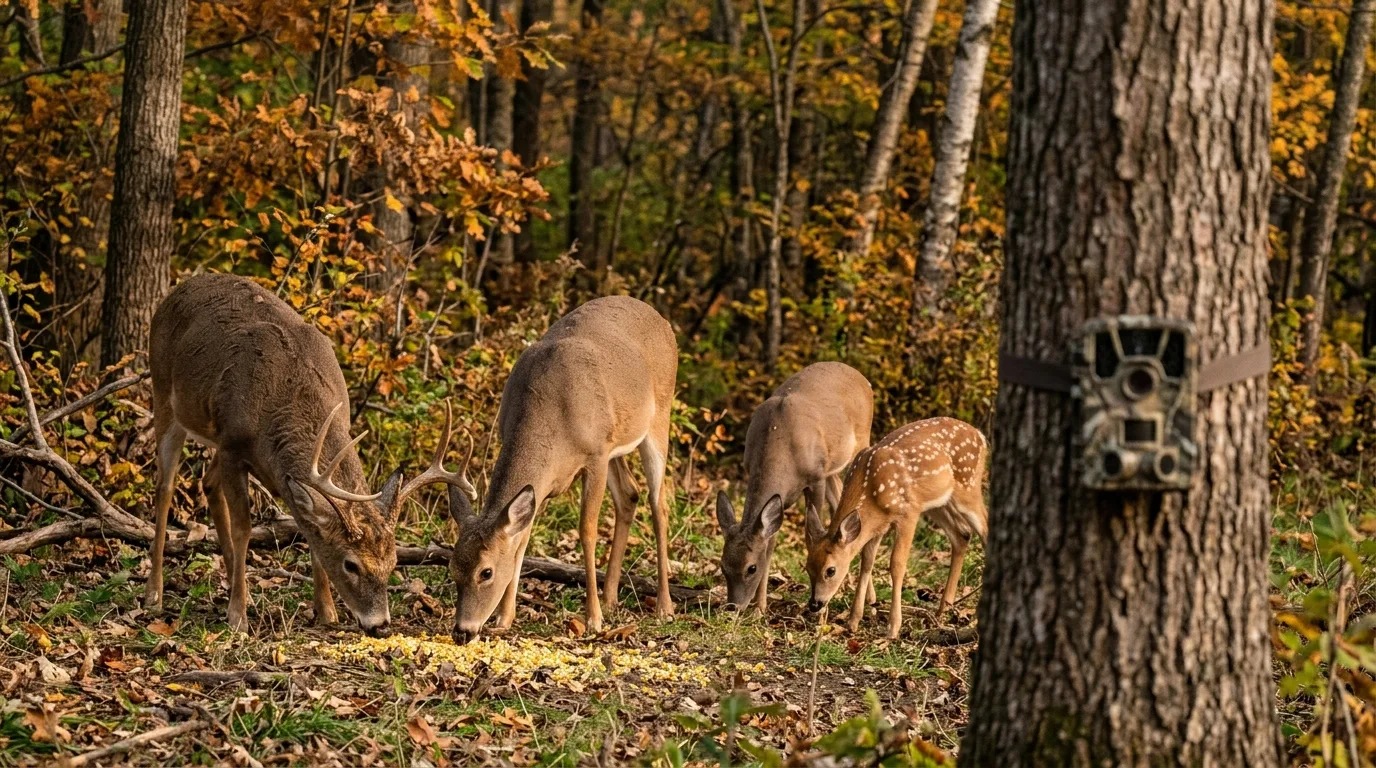
The entire method depends on pulling deer in front of cameras, and bait is how you do it. Shelled corn is the standard — cheap, available, and deer come to it readily. It isn't strictly required; you can run cameras over food plots and natural food sources without bait if you have to. But bait dramatically increases visitation and, just as important, keeps a buck at the site long enough to photograph his antlers from several angles, which is exactly what you need to identify him.
Before the survey proper, you pre-bait to get deer into a routine of visiting each site. Here's where the sources genuinely disagree, so treat the range as a menu, not a contradiction: recommendations run from a minimum of four to six days, to five to seven days, to seven to ten days, to ten to fourteen days, with Missouri's guide simply saying about a week with 50 pounds of corn. Bait amount varies too — most guides say 20 to 25 pounds per site to start. The principle underneath all of it: pre-bait long enough that deer are hitting every site regularly, check with your cameras during this phase to confirm it, and use the time to dial in camera height and distance so deer land centered and identifiable. Stop any supplemental feeding elsewhere on the property for the duration so your bait sites are the only game in town.
Two practical bait notes the field-tested guides won't let you skip. First, aflatoxin — corn left out in warm, moist conditions grows mold that produces toxins which suppress deer immune systems and cause liver damage; keep surveys short, avoid baiting above about 60°F or when grain moisture tops 18 percent, scatter rather than pile the corn, and never use moldy grain. Second, non-target species. Corn pulls in everything: in one Oklahoma State field comparison, 78.5 percent of non-target photos at corn sites were birds, plus raccoons and squirrels. Switching to milo (grain sorghum) cut bird captures and slashed raccoon visits to a fraction, which means less bait eaten, less film to sort, and less aflatoxin risk. And wild pigs are their own nightmare — when hogs find a bait pile they push deer off and clean it out, so if you've got pigs, expect to relocate at least one site mid-survey.
The word that should be tattooed on your survey plan is consistency. The bait has to be equally attractive year to year, bucks and does have to be drawn equally, and you have to run the same sites at the same time the same way each season — those are literally the assumptions the math rests on. The Oklahoma State data makes the stakes concrete: at the same site in the same year, corn produced a doe-to-buck ratio of 1.49 and milo produced 2.56. Same deer, different bait, wildly different "result." Change one variable and you're no longer comparing this year to last — you're comparing apples to a different orchard. Pick a bait, pick a protocol, and don't deviate.
Same deer, different bait, wildly different "result."
Running the survey
Once deer are visiting reliably, the active survey is the easy part. Program each camera to stamp date and time and to wait roughly five minutes between photos — long enough to avoid a glut of repeat images of the same deer standing at the bait, short enough to catch animals that only pass through briefly. Most guides land on a 5-to-10-minute delay; a few go as fast as one minute if you can stomach the sorting. Trigger speed, by the way, is the one camera spec you can ignore for a survey — deer give you plenty of chances at a bait site, so prioritize image quality for identification over a fast trigger.
How long? The consensus is 10 to 14 days, and the reason is a clean piece of research: a two-week run at one camera per 100 acres photographs about 90 percent of the deer visiting your sites, while 10 days gets you about 85 percent. Alabama's guide notes 7 to 10 days is sufficient — but flags that this came from high-fenced research and that accuracy drops in free-range herds. Mississippi's deer lab splits the difference: 5 to 10 days is adequate, but you'll get noticeably better numbers from a full 10-to-14-day run, particularly if identifying individual bucks matters to you. If money or gear is tight, 10 days is a legitimate floor; if you can manage 14, do it.
While it runs, check sites every other day or so — every four to five days at the outside. Each visit: record how many photos the camera took, swap or download cards, check batteries, top off bait, and snap a test photo of yourself to confirm the camera fired. Don't skimp on batteries; you've sunk too much time to lose a week of data to a dead camera. And stay out of there during dawn and dusk when deer are moving, with gloves and rubber boots and real scent control — you're trying to photograph deer, not condition them to your presence.
A quiet word on flash. For pure scouting, infrared is fine. For a survey, where telling a forked buck from a spike at night is the whole ballgame, standard white-flash cameras have a real edge — they record color images at night with more detail, while infrared night shots are darker black-and-white frames that hide antler detail and can blur moving deer. There's little evidence a flash spooks deer enough to matter.
For a survey, telling a forked buck from a spike at night is the whole ballgame.
Crunching the numbers
This is the part that turns photos into management data, and it's simpler than it looks. The method — often called the Jacobson method, or the individual branch-antlered male (IBAM) method — hinges on one move: antlered bucks are the only deer you can reliably tell apart as individuals, so you use them to figure out what fraction of the herd your cameras actually caught.
Sort every photo into bucks, does, and fawns, counting each animal in each frame (a photo with two does and a fawn is three counts), and tally totals including repeats. "Fawns" means every deer under a year old, button bucks included. Then comes the key step: study the buck photos and count how many unique bucks are in there, using antler configuration — number of points, tine length, spread, abnormal points — plus body and pelage traits. Toss any deer you genuinely can't identify. This is the make-or-break number; the original researchers found that "the most critical factor" in the whole estimate was accurately identifying individual branch-antlered bucks.
Now the ratio. Divide unique bucks by total buck photos to get a population factor. Oklahoma's agency frames it in plain numbers: 100 buck photos and 10 identifiable individuals gives a ratio of 10 percent. That fraction is your scaling key. Multiply the total doe count and total fawn count by it to estimate the unique does and fawns on the property. Add your three real numbers — unique bucks, estimated does, estimated fawns — and you have a population estimate. Acres divided by that total is your density.
From there the ratios fall out: does divided by bucks is your sex ratio, fawns divided by does is your fawn crop. Texas's worked example runs the whole chain on 600 acres: 6 cameras, 10 days, 196 deer photographed (36 buck photos, 11 individual bucks, 108 does, 52 fawns); factor of 11/36 = 0.31; estimated population of 60 deer; 10 acres per deer; a 3:1 doe-to-buck ratio; and 48 percent fawn production.
One refinement the better guides add: a correction factor to account for the deer you never photographed. Since a 14-day survey catches about 90 percent of deer, you scale your estimates up by dividing by that percentage. The National Deer Association keeps it tidy — multiply each buck, doe, and fawn estimate by 1.11 for a 14-day survey, or 1.18 for a 10-day survey. Mississippi State arrives at essentially the same place from its own capture tables: a 10-day winter survey at one camera per 100 acres photographs about 89 percent of the herd, giving an extrapolation factor of 1.12. Worth noting that not every guide bothers — the Texas, Missouri, and Oklahoma State worked examples stop at the raw scaled estimate without applying a correction. If you want to compare honestly to other people's numbers, know which convention you're using and stick to it.
Reading what you got — and what the numbers mean
A population estimate is only useful if you know how to read the ratios.
On sex ratio, your target depends on your goal. If you want maximum deer to harvest each year (maximum sustained yield), aim for about 1:3 — one buck per three does. If you want bigger bucks and fawn survival is solid, push toward 1:1. But calibrate your expectations: the biological reality is that pre-hunt adult sex ratios can't get nearly as lopsided as hunters claim. As long as a herd recruits fawns, the maximum naturally achievable ratio is about 5:1 — claims of 10:1 or 15:1 simply can't be true pre-hunt adult ratios, because roughly half of all fawns born are bucks, which corrects the ratio every year. The national average sits around 1.9 to 2.0 does per buck, ranging from about 1.1 to 3.1 across states. If your survey spits out 8:1, your method is off — almost certainly too few cameras over-sampling bucks — not your herd. And one rule you cannot break: the sex ratio only means something if it's a pre-hunt measurement; post-hunt ratios are heavily skewed toward antlerless deer. That's exactly why a late-summer camera survey beats every other tool for this number.
On fawn recruitment, the benchmark from two leading deer biologists: historically healthy herds recruited 0.9 to 1.2 fawns per doe, and a number down around 0.4 to 0.5 or less signals a productivity problem — often habitat, sometimes coyote predation, which takes 10 to 20 percent of fawns on average in Midwestern and Northeastern studies and more in parts of the Southeast. The management move is simple and proactive: when recruitment trends down, get more cautious with doe harvest.
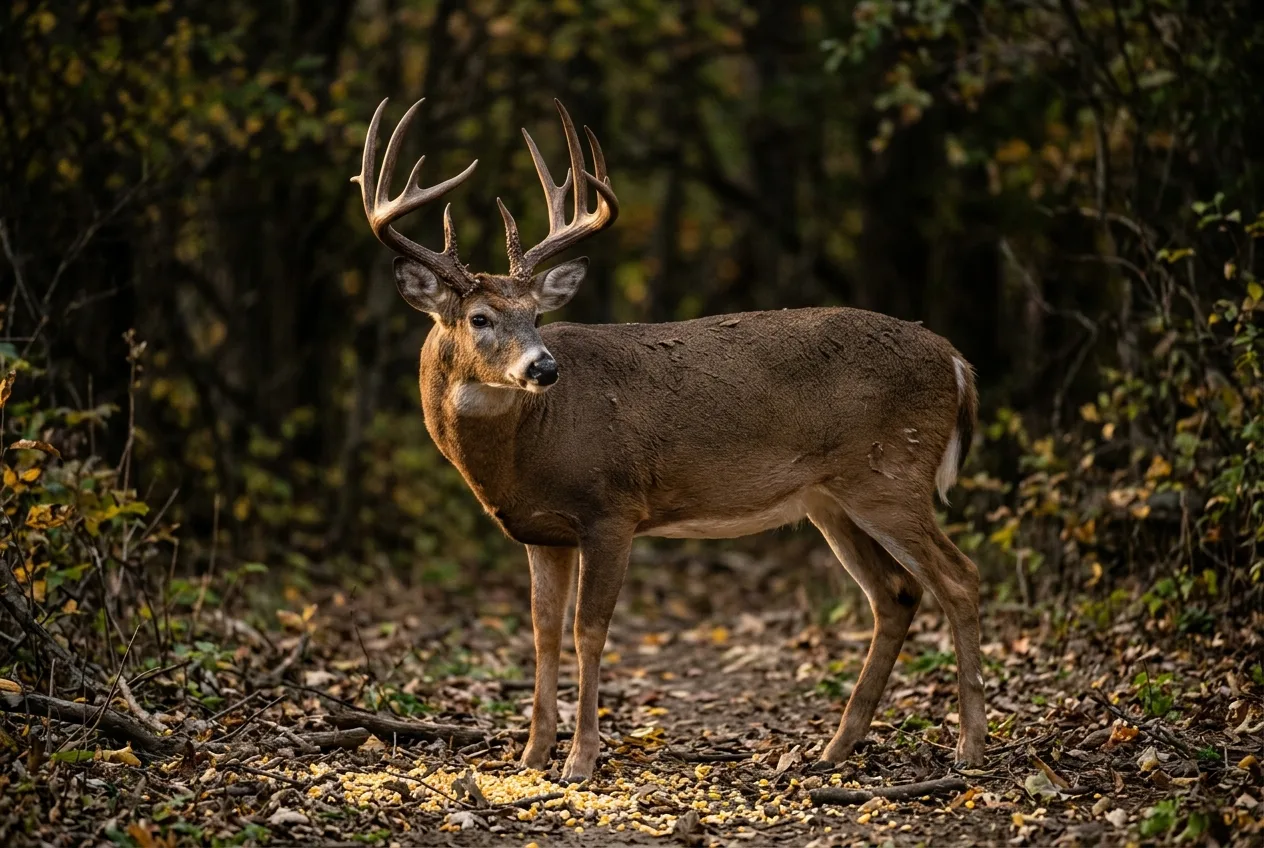
On age structure, this is where the survey gets fun and personal — you're seeing the individual bucks on your land and deciding who's a shooter and who gets another year. The context for why this matters: before quality deer management caught on, yearling bucks made up 70 to 90 percent of the annual harvest across much of the whitetail's range. Pre-season photos let you flip that, protecting young bucks and targeting mature ones. A Virginia hunter's account captures the value better than any statistic — he tracked a distinctively antlered buck he'd nicknamed "Train Wreck" through a whole summer of trail-camera photos, knew him on sight when the season opened, and "the decision to shoot this buck had played out endless times in my mind over the past several months". That's what an inventory buys you: certainty in the five seconds you have to decide.
That's what an inventory buys you: certainty in the five seconds you have to decide.
Where the method gets shaky
I'd be doing you a disservice to hand you a clean recipe and skip the caveats, because the honest experts in these sources don't. A camera survey is a tool, not, as Alabama's extension office puts it, the "silver bullet".
The biggest limitation is free-range vs. fenced. Almost all the impressive capture-rate numbers — that 85-to-90-percent figure — come from high-fenced or semi-enclosed research areas. In an unfenced population, deer constantly move on and off your property, and your ability to accurately estimate density drops substantially. Alabama's guide goes as far as to say that "drawing conclusions about a population of deer, such as density, based solely on pictures is generally a poor idea". That's a strong statement from a source that otherwise endorses the method — the point is to treat your density number as an index and a trend, not gospel.
Second, the method tends to undercount does and fawns. Multiple state guides now carry the same caveat: recent research suggests camera surveys may underestimate the number of does and fawns, which throws off both your sex ratio and your total population if you don't correct for it. The underlying cause is detection bias — does, bucks, and fawns don't all show up at bait with equal probability. A modification of the original method addressed exactly this by standardizing photo counts by each group's trap success rate; because females showed higher trap success, the adjustment lowered the female-to-male ratio and raised the fawn-to-female ratio relative to raw counts. The practical lesson: don't treat a single year's raw ratios as precise truth.
Third, fawn recruitment specifically is hard to nail. When researchers checked camera-based fawn-to-doe ratios against actual radio-collared fawn survival over multiple years, the relationship was real but loose — an R² of 0.445 at one site, improving to 0.621 across two — and they explicitly urged "caution when advocating the use of camera-based recruitment estimates". The encouraging part: year-to-year trends tracked better (R² of 0.758) than absolute values. Which is the theme of this whole enterprise — cameras are better at telling you which direction your herd is moving than at handing you a perfect headcount.
Finally, even a perfect density estimate doesn't tell you what to do. Knowing how many deer are on a property doesn't tell you whether to shoot more or fewer — for that you need some measure of habitat condition and deer body condition, which is why every serious guide insists you pair camera data with harvest records like body weights and lactation rates.
None of this is a reason to skip the survey. It's a reason to run it the same way every year, lean on the trends, correct for known biases, and cross-check it against what you see on the hoof and at the skinning shed. Do that and a trail camera deer survey is genuinely the most powerful herd-monitoring tool a landowner can run alone.
If you're new to the gear side of this, it's worth getting placement basics down before you scale up to a full grid Trail Camera Placement for Beginners: Height, Angle, and Direction, and once you have a season of photos, the timestamps on them can tell you a lot about deer movement beyond just counts From Timestamps to Animal Activity Patterns: A Camera Trap Workflow.
Frequently asked questions
How many trail cameras do I need for a deer survey?
Plan on one camera per 100 acres for properties under about 1,000 acres, and one per 160 acres on larger tracts. Too few cameras over-sample wide-ranging bucks and miss does, which skews your sex ratio — so on small properties, add cameras or partner with neighbors to survey the whole block.
How long should a trail camera deer survey run?
Ten to 14 days. A 14-day survey photographs roughly 90 percent of the deer visiting your sites; 10 days gets about 85 percent and is a fine budget option. Pre-bait the sites for several days to two weeks beforehand so deer are visiting reliably when the clock starts.
What's the best bait for a deer camera survey?
Shelled corn is the standard — cheap and deer come to it readily. Milo (grain sorghum) is a strong alternative that attracts far fewer non-target birds and raccoons and carries less aflatoxin risk. Whatever you choose, use the same bait every year, because switching bait can swing your estimated sex ratio dramatically.
Can I run a deer survey without bait?
Yes, but it's harder. Bait isn't strictly required — you can place cameras over food plots and natural food sources — but it greatly increases how many deer you photograph and keeps bucks in frame long enough to identify them. Most peer-reviewed density work that avoids bait uses more advanced math (mark-resight or N-mixture models) rather than the simple Jacobson ratio.
Why does my survey show way more does than bucks?
A modest skew is normal, but a wild one (8:1 or more) usually means a flawed survey, not a real ratio. Pre-hunt adult ratios can't naturally exceed about 5:1, and the national average is closer to 2:1. The usual culprit is too few cameras over-sampling bucks, or measuring after the hunt when antlerless deer dominate. Add cameras and survey pre-season.
Are camera survey numbers accurate enough to set my harvest?
Use them as trends, not gospel. Free-range estimates are less precise; surveys also tend to undercount does and fawns, and camera-based fawn recruitment tracks real survival only loosely. Run the survey identically every year, watch the direction it moves, and pair it with harvest data like body weights before making big harvest calls.