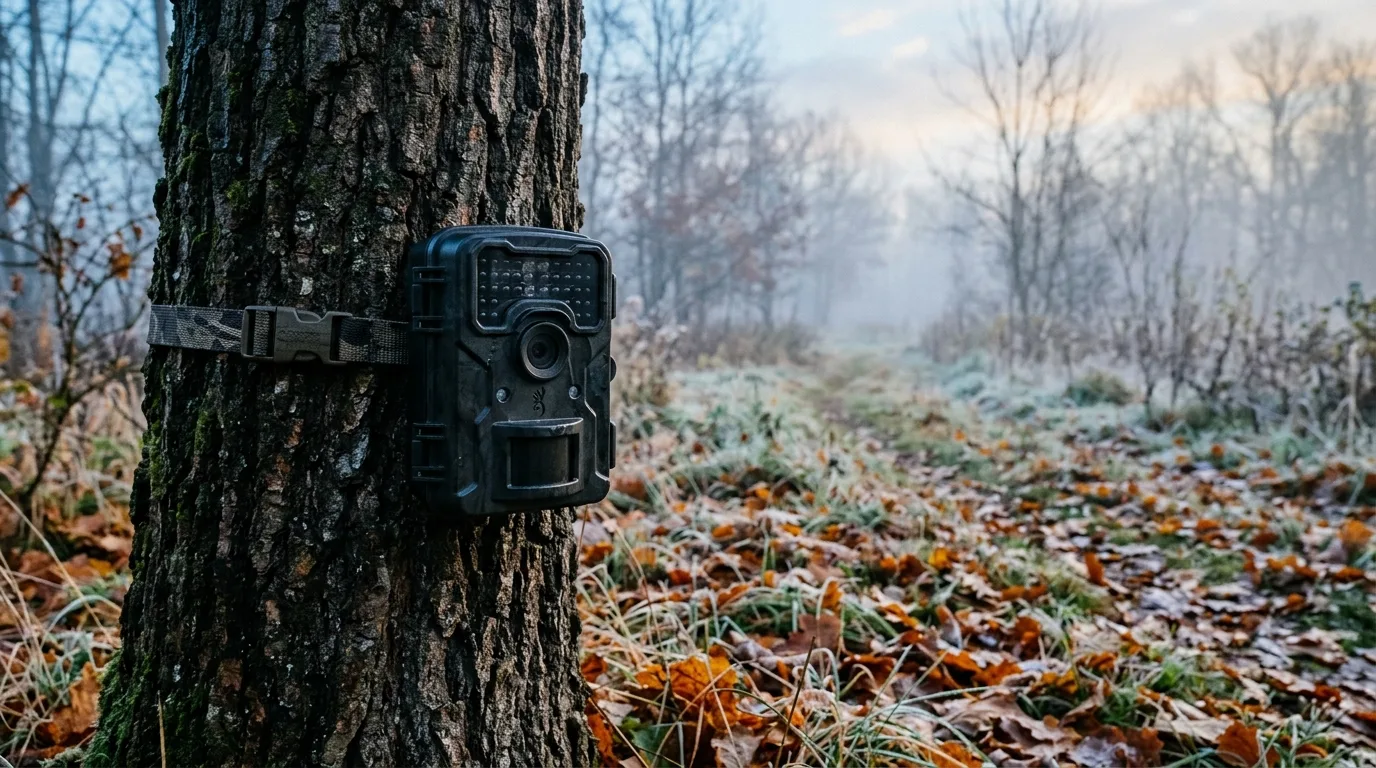
Look at the bottom of almost any trail camera photo and you'll see it: a thin black bar crammed with numbers and symbols. A date. A time. A little thermometer reading. A sliver-of-moon icon. Maybe a temperature, a battery bar, a name you typed in months ago and forgot about. Most people glance past it on the way to the deer. That strip is the most undervalued part of the photo — and once you can read it, every image you've ever taken turns into a data point instead of just a picture.
Here's the quick version. That data bar is the camera telling you when the photo happened, how warm it was at the unit, where the moon was in its cycle, and which camera took the shot. The date and time are the load-bearing part — get those wrong and everything else you try to learn from the photo is built on sand. The temperature is roughly useful but surprisingly unreliable. The moon phase is real astronomy but a weak predictor of the thing most people hope it predicts. And the camera ID is the boring field that quietly keeps a multi-camera setup from collapsing into chaos. Let's walk through each one, what it actually means, and — more to the point — what a smart person does with it.
Where the strip comes from (and where it doesn't)
Two different things are happening on that bar, and it helps to separate them.
The date, time, temperature, moon icon, and camera name are stamped onto the image by the camera itself, at the moment it fires, using its own internal clock and sensor. But there's a second, invisible layer. Every modern camera also writes the capture time into the photo's EXIF data — Exchangeable Image File Format, the technical metadata digital cameras bake into JPEGs. You don't see EXIF on the photo, but software does, and that timestamp is the hook that lets apps pull in extra data after the fact. trail.cam, for example, takes each photo's timestamp and automatically links weather from the nearest station to the observation — temperature, conditions, wind, barometric pressure, humidity, sunrise and sunset, and moon phase.
That distinction matters more than it sounds. The barometric pressure and moon phase you see in an app were almost certainly not measured by your camera — they were calculated from the timestamp and a weather database. Your camera has a thermometer and a clock; it does not have a barometer or a window on the sky. Keep that in the back of your mind as we go, because it changes how much you should trust each field.
Date and time: the field everything else depends on
If you only ever check one thing on the strip, check the clock.
The timestamp is the photo's anchor in time. In EXIF terms, the relevant tag is `DateTimeOriginal`: "the date and time when the original image data was generated. For a DSC the date and time the picture was taken are recorded," in the format `YYYY:MM:DD HH:MM:SS` on a 24-hour clock. When it's set correctly, it's trustworthy down to the second. The problem is that little phrase — when it's set correctly.
Cameras are shockingly easy to get wrong on time, and a wrong clock quietly poisons everything. Researchers who built software for analyzing camera-trap images cataloged the four ways timestamps go bad, and every one of them shows up on backyard cameras too:
- The clock was never set right at deployment. You put fresh batteries in, hit go, and never noticed the date defaulted to the factory setting. Now every single photo is off by the same fixed amount.
- Daylight saving time. The camera doesn't spring forward or fall back, so a whole stretch of your photos is off by exactly an hour.
- Clock drift. The internal clock runs a hair fast or slow, so the error grows over weeks — the date and time of successive images become "increasingly inaccurate" the longer the camera sits.
- Ambiguous date format. A date written `02/10/2019` could be October 2 or February 10 depending on whether the camera uses day/month or month/day order — and cameras that record only a two-digit year (`02/10/10`) make it worse.
None of these stop the camera from taking pictures. They just make the pictures lie about when. And the entire reason the time is worth obsessing over is that time of day is the single most reliable signal of animal activity you'll ever pull off that strip — far more dependable than temperature, moon, or pressure.
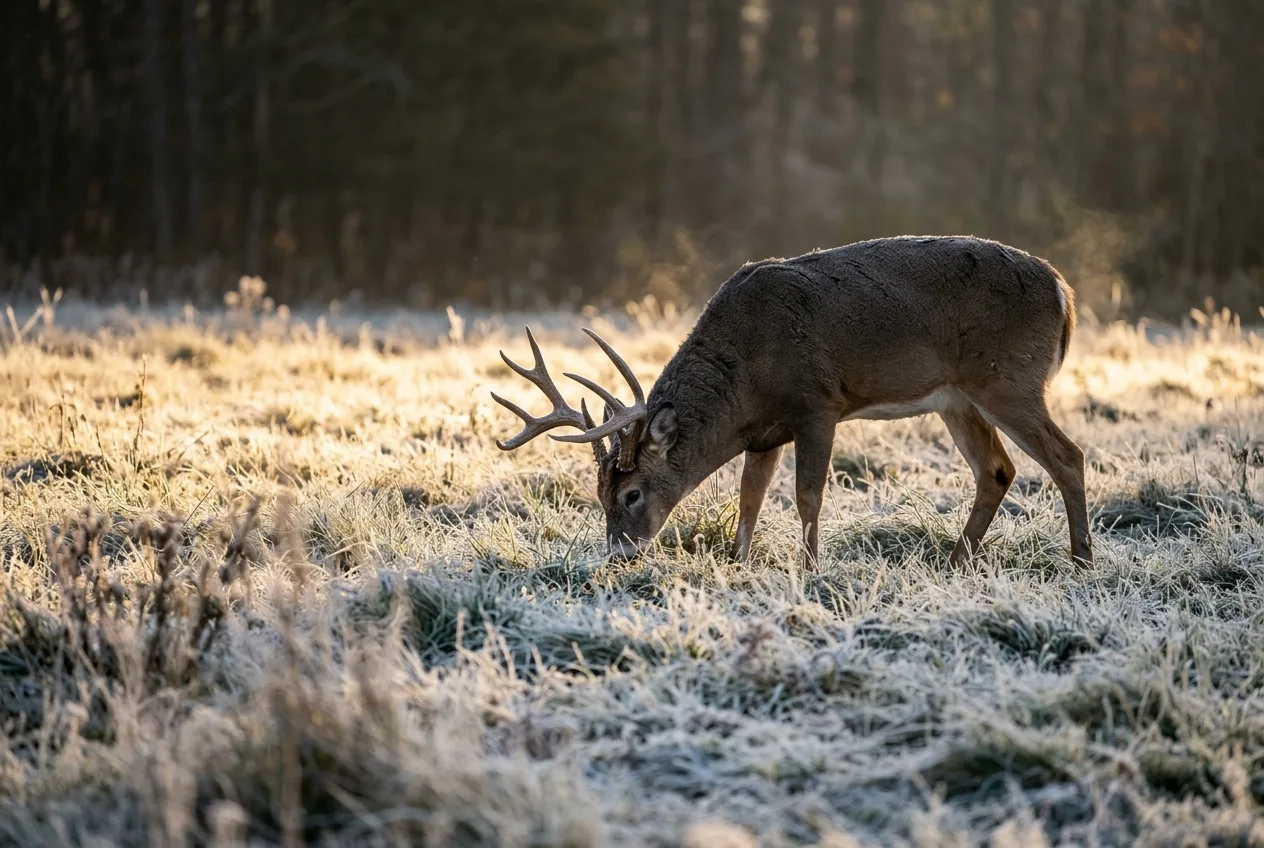
Consider what good timing data reveals. A GPS study of red deer in the Netherlands and elk in Canada found that activity peaks "always lagged behind" civil twilight — the animals didn't anticipate dawn and dusk, they reacted to the changing light, with the morning peak landing almost two hours after first light in the Canadian herd. White-tailed bucks are textbook crepuscular: about 60 percent of what they do during the twilight hours is feeding or walking, and they're bedded most during midday. That dawn-and-dusk rhythm is the heartbeat your timestamps are recording. Get the clock right and your photos draw that curve for you. Get it wrong by an hour and a "first light" photo reads like a mid-morning one.
Accurate time also lets you see behavior change over a season. When hunting pressure arrives, deer don't necessarily leave — they go nocturnal. A culling study on sika deer documented activity peaks shifting toward the night as pressure increased, and the shift persisted even after the culling stopped. On managed land, bucks hit food plots and feeders far more at night than by day once the season opens. That entire story — a herd quietly flipping from daytime to nighttime — is invisible without trustworthy timestamps. The numbers on the strip are the only record of it.
So before a camera goes out: set the date, time, and format by hand, double-check AM/PM, and when the season's clocks change, remember your camera won't. From Timestamps to Animal Activity Patterns: A Camera Trap Workflow
That dawn-and-dusk rhythm is the heartbeat your timestamps are recording.
Temperature: useful, but don't trust it to the degree
Most cameras print a temperature on the strip, and it feels authoritative. Treat it as a rough guide, not a calibrated reading.
Here's the uncomfortable truth a careful tester documented: the temperature on the info strip can be way off, because the camera measures the air around its own electronics, not the forest. During a "runaway" event — where a camera gets stuck firing shot after shot — the strip temperature climbed "as much as 40F" above the actual conditions in one case, and 30F above its own starting point in another. The culprit was internal heat from mismatched batteries, with weak cells measured at over 110F under load. The weather outside hadn't moved; the camera was cooking itself and reporting the result as if it were the weather. The practical fixes there double as good habits anyway: use fresh, matched batteries of one chemistry, and set a short rest between triggers so the unit can cool.
Even when the reading is honest, temperature is a weaker predictor of deer movement than hunting lore suggests. A Mississippi State analysis found "minimal evidence that weather was having an influence on deer movements," with relationships that were "weak" and of "little biological significance". A Texas study found "no correlation" between male activity and temperature. The National Deer Association's review of the GPS research lands in the same place: temperature has some influence, but the impact on overall distance moved is "negligible," and the closer you get to the rut the less any weather variable matters.
That said, this is exactly where honest sources disagree, and you should know it. North Carolina State researchers found air temperature was a "consistent predictor of buck movement across all seasons," even if the effect was subtle. And plenty of experienced hunters swear a sharp cold snap gets deer on their feet — a tension the science journalists covering this topic name outright: weak correlations in the collar data, strong conviction in the field. Dr. Bronson Strickland of the MSU Deer Lab splits the difference about right — there are changes when a front pushes temperature around, "but again, it wasn't that dramatic. It was always subtle".
So the temperature on your strip is worth logging. Just don't bet the morning on a number that might be reading your battery pack, and don't expect it to move deer the way a calendar full of rut dates will.
Moon phase: real astronomy, oversold as a movement predictor
That little moon icon is the field people most want to be magic. The astronomy behind it is solid. The hunting promise attached to it mostly isn't.
First, what the icon means. The moon runs through eight named phases — New, Waxing Crescent, First Quarter, Waxing Gibbous, Full, Waning Gibbous, Last Quarter, Waning Crescent — over a complete cycle averaging 29.5 days, per the U.S. Naval Observatory. At New Moon the illuminated fraction is 0; at the quarters it's 50 percent; at Full it's 100 percent. So a half-lit icon genuinely tells you the moon was throwing real light that night, and a new-moon icon tells you it was dark. That part is true and precise.
The popular leap — that a full moon pins deer down at night and frees them by day, so you should plan hunts around the lunar calendar — is the part the data keeps refusing to support. This idea traces back to John Alden Knight, who popularized the "Solunar" tables in 1936. Modern GPS collars have tested it to death:
- Penn State collared adult does and found deer moved about 6 meters more per hour at a new moon than a full moon — a difference the researcher called "merely a few steps," meaningless against a movement range of 0 to 2,748 meters per hour.
- The MSU Deer Lab tracked 48 collared bucks across a full season. Bucks averaged 265 yards per hour during legal shooting hours; the rut nearly doubled that. The best the "best" moon day could muster was a 4-yard-per-hour bump with essentially no change in bedding time. Their verdict: the differences were "trivial," and "there's no conclusive data to support a relationship between moon phase/position and buck movement".
- The MSU Extension summary of years of this work puts it flatly: "There is absolutely no pattern of variation that can be associated with moon phase".
And yet most hunters believe the opposite — 83 percent of about 1,400 surveyed by the MSU team said the moon affects deer activity. Even the believers have receipts: veteran biologist Grant Woods once predicted deer activity with 72 percent accuracy off a moon-based index built on 1,160 hunts and 2,815 observed deer — until he put GPS collars on deer and concluded there are "zero relationships with the moon". The collar, watching a deer 24 hours a day, simply doesn't see what a hunter watching from a stand thought they saw.
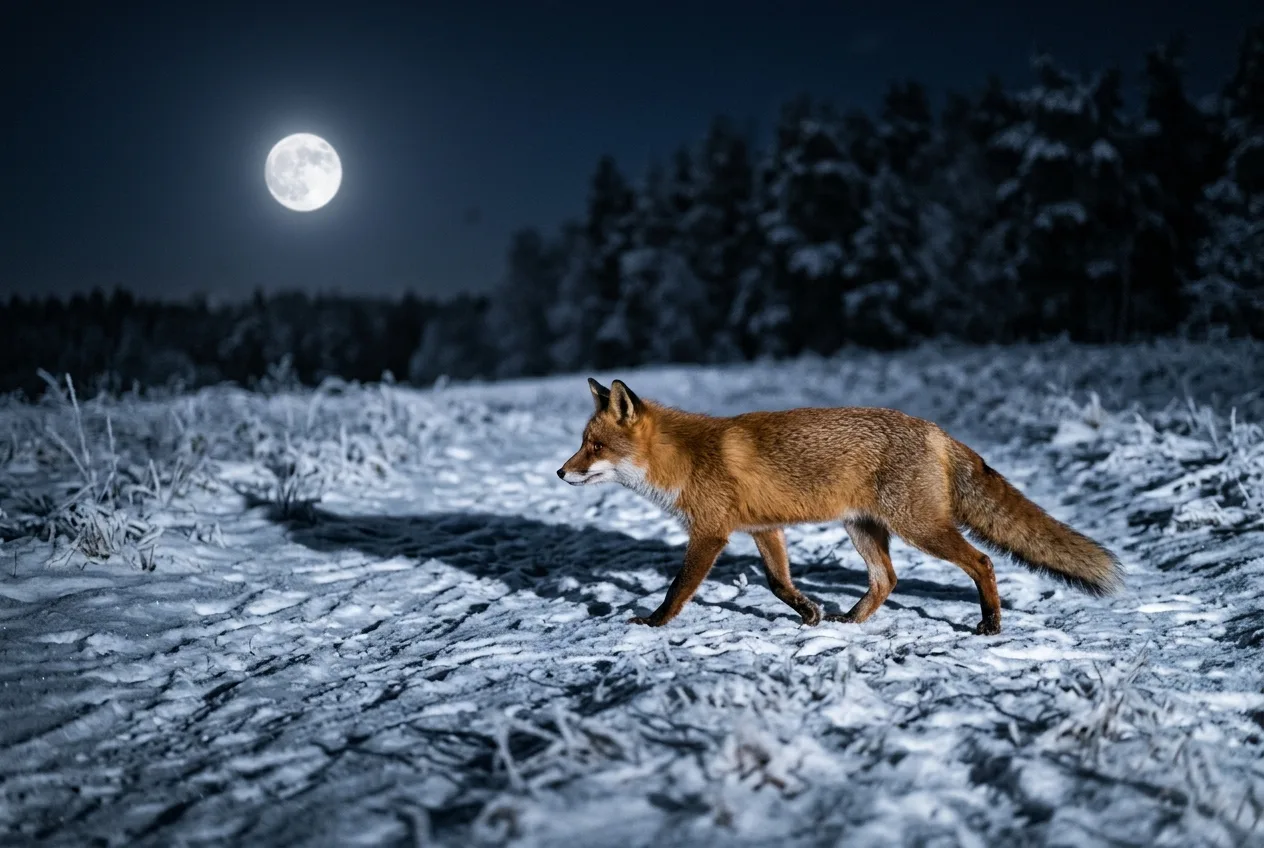
So is the moon field useless? No — and this is the nuance worth holding onto. Moonlight clearly changes the behavior of many other animals, even if it barely budges a whitetail. A camera-trap study in China found roe deer were more active under a full moon while wild boar and hare avoided it. Across 341,959 muskellunge catch records, anglers caught about 5 percent more fish around the full and new moon — and up to 28 percent more at night around the full moon. In controlled trials, bank voles cut their visits to moonlit feeding patches at night, presumably to stay off a predator's menu. If you're running cameras for foxes, hares, small mammals, or anything that lives or dies by how visible it is in the dark, that moon icon is a genuinely useful variable. For patterning a buck, let it go. Does the Moon Phase Affect Deer Movement? What the Data Shows
The collar, watching a deer 24 hours a day, simply doesn't see what a hunter watching from a stand thought they saw.
Barometric pressure: what it is, and the honest debate
If your strip or app shows barometric pressure, here's the plain-English version: it's the weight of the atmosphere pressing down, "the pressure of the atmosphere as indicated by a barometer," in the National Weather Service's words. Standard sea-level pressure is about 1013.25 millibars, or 14.7 pounds per square inch. High pressure generally means sinking air and clear skies; low pressure means rising air that cools, condenses, and brews clouds and storms. So a falling number is, loosely, weather on the way.
Remember the earlier caveat: your camera isn't measuring this. The pressure value comes from the timestamp matched to a weather service, not from a sensor in the housing. It's still real data — just sourced from the sky, not your camera.
Whether it predicts movement is, again, a genuine argument. On the skeptical side, the NDA's review of the collar research found no consistent weather-driven pattern strong enough to plan a hunt around. On the believer side, the most-cited practitioner study — a seven-year project by Todd Amenrud — reports that whitetails "seem to move best when the pressure is between 29.90 and 30.30 inches," with the best movement at the high end, "around 30.10 to 30.30 inches," and argues barometric pressure "had more influence than any other occurrence" he studied. His real point isn't the absolute number, though — it's the change: "It's the rapidly rising or declining barometric pressure that precedes or follows a weather front that seems to show the biggest impact".
There's at least some peer-reviewed reason animals might sense it. White-crowned sparrows in a controlled study responded to declining barometric pressure — pressure dropped on average by 2.31 kPa in the 12 hours before snowfall, and falling pressure "stimulated food intake," as if the birds were fueling up before a storm. So the mechanism isn't pure folklore. Just hold the deer-specific numbers loosely, watch the trend more than the value, and weigh it against the more reliable signals on the strip.
Camera ID: the boring field that saves your whole survey
The least glamorous item on the bar is the one that scales. Once you're running more than a camera or two, the name or ID stamped on each photo is what keeps your data from turning into a shoebox of unlabeled prints.
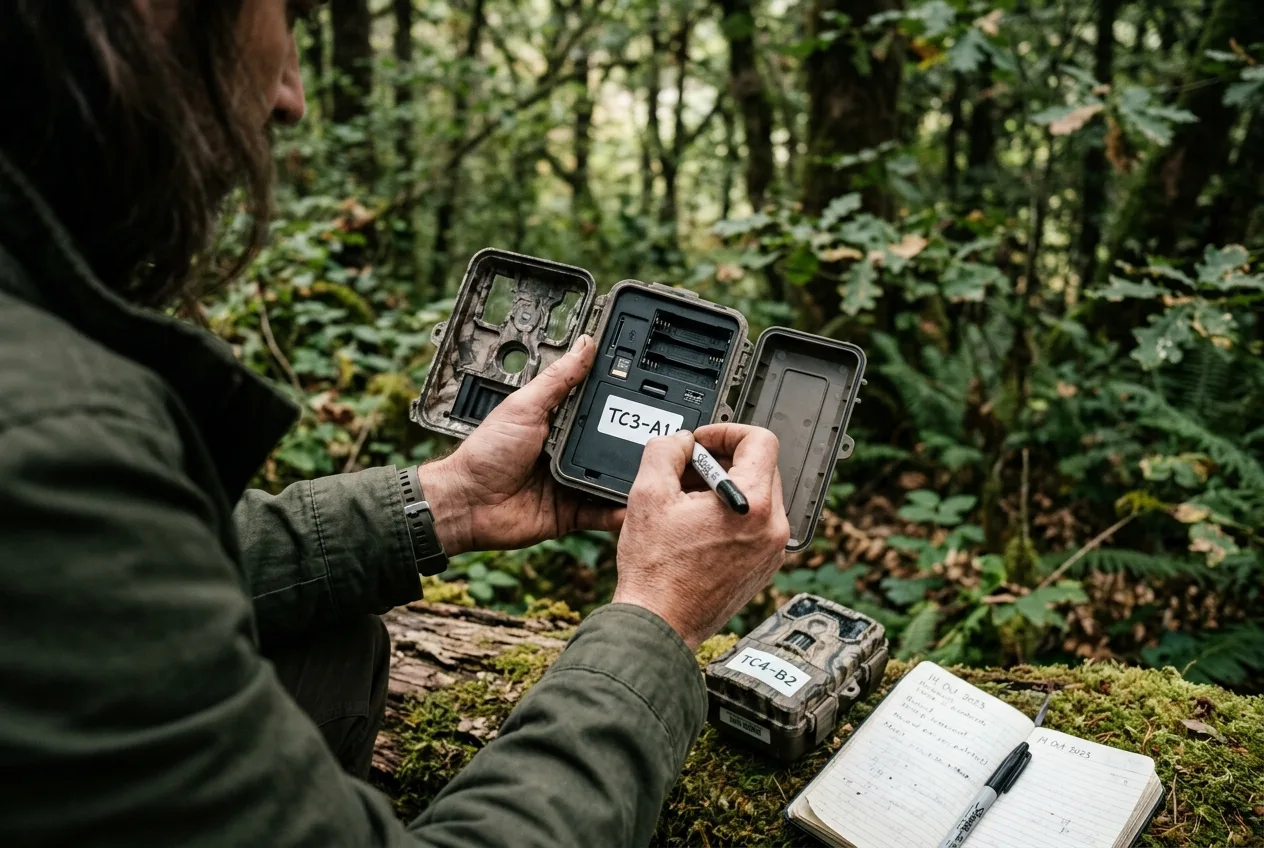
Many cameras let you type a name in the settings that then prints on the data bar, so the camera name doubles as its ID. Use it. The principle from conservation practitioners is simple: give every camera a unique identification, and back it up physically — write the ID on the inside of the camera door with a marker so a dead battery never erases which unit is which.
For more than a handful of cameras, a little structure pays off enormously. NatureSpy's Yorkshire Pine Marten Project runs 50 cameras split into 5 survey sets; each camera gets a set and a number, so the first camera in set 1 is simply 1-1. That single project pulled 300,000 videos down into 16,000 useful records across 62 species — a haystack you can only search because every needle was labeled. The same logic works at hobby scale: name by place. One hunter organizes everything by property and location, renaming a photo something like `LR_AT_4x5 (3)` — Luce Road, Apple Tree, a 4-by-5 buck, third sighting — so the filename alone tells him where the deer was and who it is. A consistent folder structure built around those IDs is what lets you find a specific camera's footage two seasons later.
EXIF carries identity too. The standard defines a `CameraOwnerName` tag and a `BodySerialNumber` tag — the serial number of the specific camera body that took the shot — which is exactly what you want if a unit is ever lost or stolen and you need to prove it's yours.
Putting the strip to work: from numbers to patterns
Individually, these fields are trivia. Together, over time, they're a map of why and when animals use a spot — and the method for reading them is refreshingly low-tech.
The trail-cam community's rule of thumb is the old fisherman's adage: "one time is by chance, 2 times is by coincidence, but 3 times is a pattern". The workflow is a spreadsheet. List every photo, fill in date and time off the strip, then add columns for the conditions you care about — temperature, wind direction and speed, barometric pressure, pressure change, precipitation, moon phase. Keep a separate tab per location so trends don't blur together. Then sort, and look for the thing that repeats three times or more. In one real example, 13 of 18 photos at a location lined up with a south wind in early November — a region where wind usually comes from the north and west, which made that pattern a genuine tell about a wind-dependent bedding area.
That's the whole payoff of learning to read the strip. The date tells you the season and the rut window. The time tells you the daily rhythm — and flags when pressure has pushed it into the dark. The temperature and pressure give you conditions to correlate, with the humility that they're rough. The moon tells you the light. And the camera ID ties every one of those readings to a place on the ground. None of it requires special gear — just the discipline to set your clock, label your cameras, and actually look at the bar you've been scrolling past. How Many Deer Are on Your Land? Running a Trail Camera Survey
Individually, these fields are trivia. Together, over time, they're a map of why and when animals use a spot.
Frequently asked questions
Does the temperature on a trail camera photo show the actual outside temperature?
Roughly, but don't trust it to the degree. The sensor reads the air near the camera's own electronics, so internal heat can throw it off — by as much as 40°F when the camera overheats. Use fresh, matched batteries and treat the reading as a ballpark.
Why is the date or time wrong on my trail camera pictures?
Almost always because the clock was never set correctly at deployment, the camera didn't adjust for daylight saving time, or its internal clock has slowly drifted fast or slow over weeks of sitting out. Some cameras also record dates ambiguously, where `02/10` could mean February 10 or October 2. Set the date, time, and format by hand before each deployment.
Does the moon phase on my trail camera actually predict deer movement?
For whitetails, no — the effect is negligible, on the order of a few yards per hour between the best and worst moon days. The moon does measurably affect other species, like foxes, hares, and small mammals that avoid bright nights, so the field isn't useless — just not for patterning deer.
Is the barometric pressure measured by my trail camera?
No. Cameras have a thermometer and a clock, not a barometer. When you see barometric pressure on a photo, an app has matched the photo's timestamp to a nearby weather station and added it. It's real weather data, just not something your camera sensed itself.
What is the camera ID or name on the data strip for?
It identifies which camera took the photo, which becomes essential the moment you run more than one. Practitioners assign each camera a unique ID — often set as the camera name so it prints on the strip — and back it up by writing it inside the camera door. On bigger surveys a structured scheme like "set 1, camera 1 = 1-1" keeps thousands of files findable.
What is EXIF data on a trail camera photo?
EXIF (Exchangeable Image File Format) is technical metadata the camera embeds in the image file, including the capture date and time, camera make and model, and serial number. You don't see it on the photo, but software reads it — and it's the timestamp inside the EXIF that lets apps automatically attach weather and moon data later. Be aware EXIF can be stripped by photo editors, by cellular-camera thumbnails, or by viewing the SD card in another device.